Community resources
Community resources
Community resources
- Community
- Products
- Confluence
- Questions
- Confluence:When we are trying to insert a JIRA query using insert JIRA issue/filter and insert the output by selecting "Total issue count" under "Display options" the insertion is getting time out. Please find the error attached.
Confluence:When we are trying to insert a JIRA query using insert JIRA issue/filter and insert the output by selecting "Total issue count" under "Display options" the insertion is getting time out. Please find the error attached.
error screenshot is attached.Server logs shows the error as com.atlassian.confluence.content.render.xhtml.XhtmlTimeoutException: Rendering this content exceeded the timeout of 5 seconds
The query we are using is below project = CE And priority = "1 - Blocker" AND issueFunction in dateCompare("", "created > resolved -1d") AND resolutiondate > "2016/11/01" AND status changed to resolved by (user1)
Here the issue is with issueFunction bcz we tried with a query without issueFunction and that worked without any problem/timeout.
Since issueFunction is creating performance issue or getting timeout, can we have any other alternatives in our requirement? Basically our requirement is as below:
We would like to capture how many CE tickets are resolved within a defined resolution time per resource (Per our SLA)
For example: We would like to capture how many blockers CE tickets are resolved by X resource within 24 hours in last 30 days. Here 24 hours are TTR(SLA) for blocker ticket.
Could anyone advice on this.
Screen Shot 2016-12-30 at 3.43.43 PM.png
Screen Shot 2016-12-30 at 3.43.25 PM.png
1 answer
1 accepted

Hi Swetha,
Am I right in thinking that "dateCompare" is a function provided by ScriptRunner for JIRA?
If so, I have a suggestion based on information here where it mentions about performance: https://scriptrunner.adaptavist.com/4.3.0/jira/jql-functions.html#_performance_2
Try re-structuring your query so that you filter out issues using the sub-query inside dateCompare.
For example, something like:
issueFunction in dateCompare("project = CE AND status changed to resolved by user1", "created > resolved -1d") AND priority = "1 - Blocker" AND resolutiondate > "2016/11/01"
Hope this helps.
I've also tagged your question with some more labels which will highlight it to other community members who may be able to help.
Sam
Hi Sam,
Yes, dateCompare being used in the above JQL query is a function provided by ScriptRunner. After i restructured the query as suggested by you.It is working fine.Thanks.
You must be a registered user to add a comment. If you've already registered, sign in. Otherwise, register and sign in.
i was able to build the wiki but i have found a weird issue now .whenever i am refreshing the page, the value shown are changing, but if i click on the value, it is showing the correct count when it shows the JIRA page.
Before refresh
image2017-1-3 13:43:7.png
After refresh
image2017-1-3 13:44:27.png
image2017-1-3 13:48:27.png
Values keep changing not sure why?
image2017-1-3 13:49:29.png
You must be a registered user to add a comment. If you've already registered, sign in. Otherwise, register and sign in.
Hmm. I do know that the JIRA issues macro caches results, which sometimes causes unusual behaviour.
If you insert the macro on your page using wiki markup, you can set the cache parameter to 'false'.
See: https://confluence.atlassian.com/doc/jira-issues-macro-139380.html (scroll to where it says "See additional parameters" at the bottom of the page) to read about this.
Assuming you have your JIRA queries saved as filters, you could try inserting the macros in Confluence using this kind of format, with cache set to false, to see if it solves the problem.
{jiraissues:url=https://jira.atlassian.com/issues/?filter=41225|cache=false}Sam
You must be a registered user to add a comment. If you've already registered, sign in. Otherwise, register and sign in.
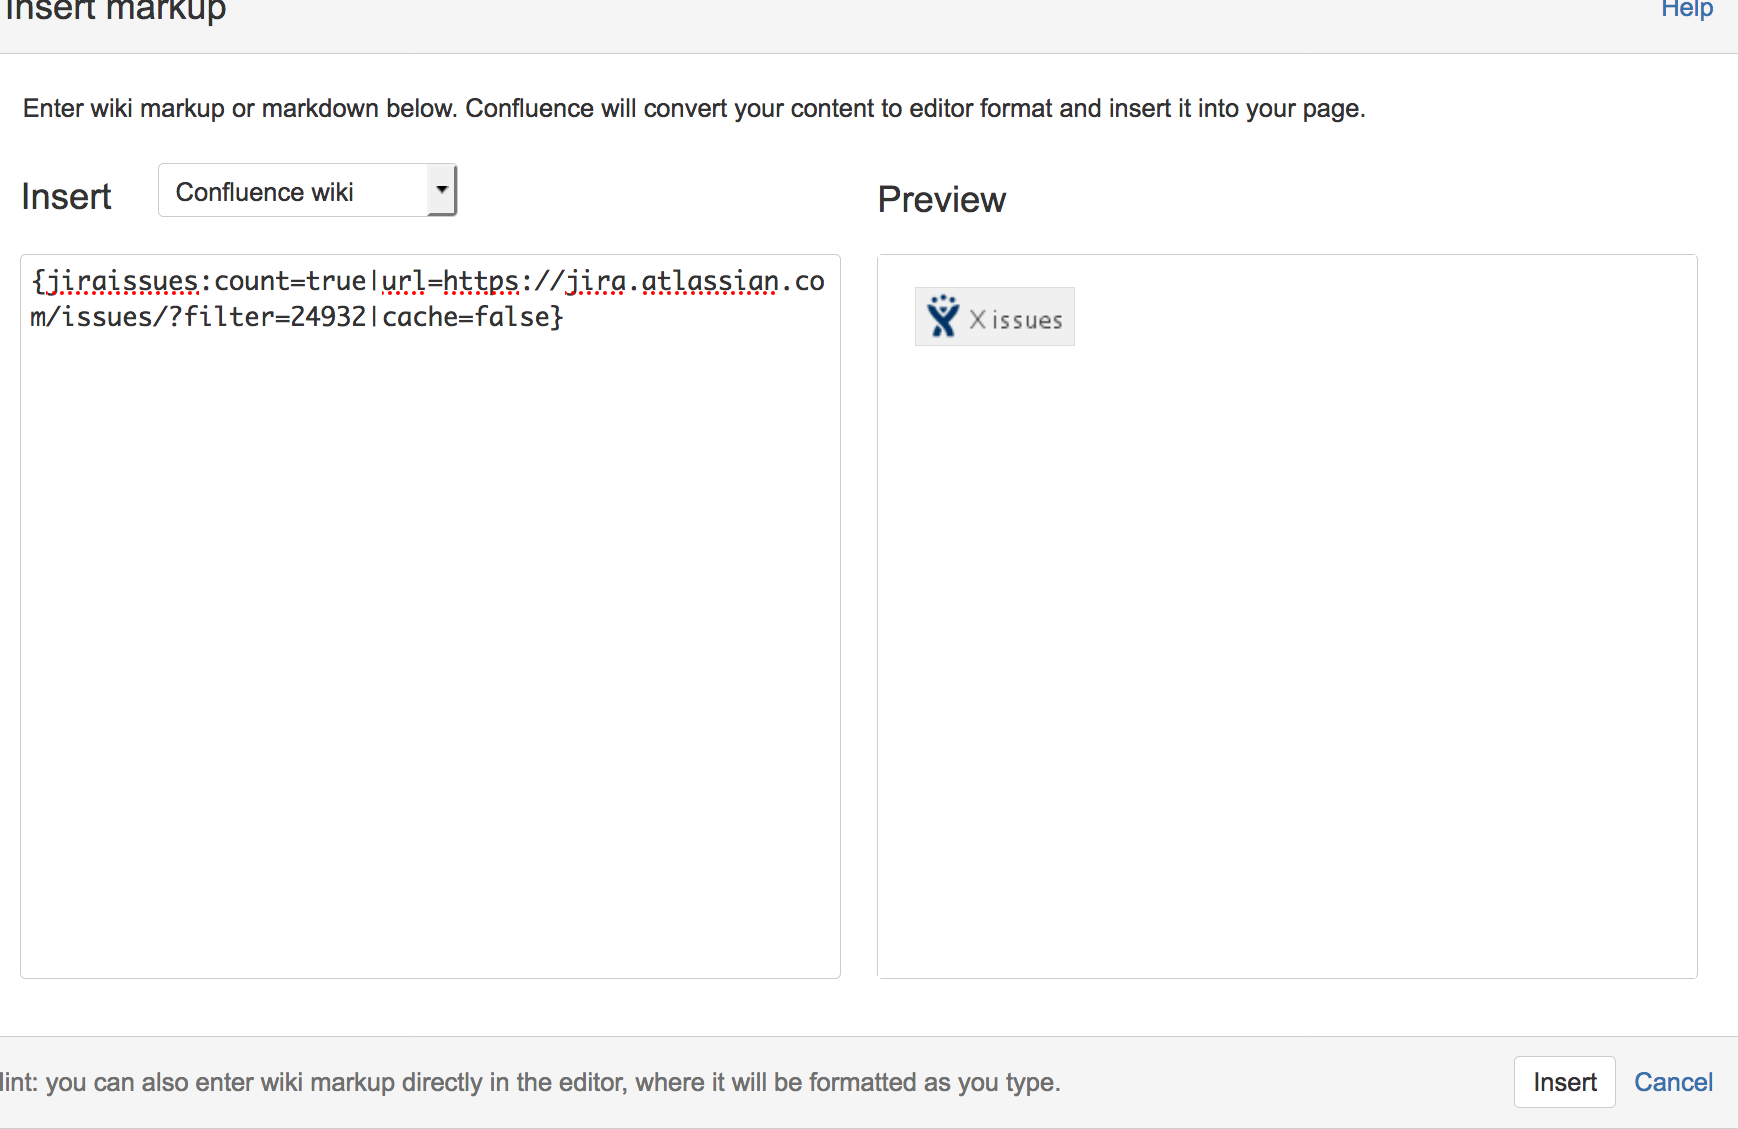
When i tried to insert the wiki markup and used count and cache to see the total no of issues without cache .Its shows X and not an actual number.
image2017-1-3 15:29:1.png
You must be a registered user to add a comment. If you've already registered, sign in. Otherwise, register and sign in.
You need to change the URL from "https://jira.atlassian.com" to whatever your own JIRA URL is.
You must be a registered user to add a comment. If you've already registered, sign in. Otherwise, register and sign in.
When using mark also the values are getting displayed correctly when we insert and in preview mode, but when we save the values are getting changed.
In edit page below is the screen shot
image2017-1-4 12:21:47.png
In save mode we see the below
image2017-1-4 12:22:16.png
when we try to mouse over both the markups shows the same filter as below when we have used different once which can be confirmed by looking at the values in edit screen.
image2017-1-4 12:26:11.png
You must be a registered user to add a comment. If you've already registered, sign in. Otherwise, register and sign in.
You must be a registered user to add a comment. If you've already registered, sign in. Otherwise, register and sign in.
What happens when you click on the links that say "1 issue"? Do both lead to the same JiRA filter?
You must be a registered user to add a comment. If you've already registered, sign in. Otherwise, register and sign in.
You must be a registered user to add a comment. If you've already registered, sign in. Otherwise, register and sign in.
Ah. I just tried a basic test and got the same problem. Looks like a bug on Confluence when entering more than one JIRA issue filter using wiki-markup in that way.
With a bit of experimentation, I think I found a workaround though. Enter your markup in this format, which uses the jqlQuery parameter, rather than the full url parameter:
{jiraissues:jqlQuery=filter=24940|cache=false|count=true}
Inserting different issue filters using that method worked for me. Each showed the correct count in page edit mode and page view mode. Let me know if it does for you.
Sam
You must be a registered user to add a comment. If you've already registered, sign in. Otherwise, register and sign in.
I tried inserting it in the above format and this time it showed the same result in Edit and saved screen. But when keep refreshing the page the correct results gets displayed half of the time i.e 1 and 9, incorrect results gets displayed half of time i.e 1 and 3. Attaching the screen shot.
image2017-1-6 10:6:43.png
image2017-1-6 10:9:0.png
You must be a registered user to add a comment. If you've already registered, sign in. Otherwise, register and sign in.
You must be a registered user to add a comment. If you've already registered, sign in. Otherwise, register and sign in.
OK. And you definitely have cache set to false on both the issue macros? Beware, if you double-click on them in edit mode to have a look, and update through the UI, it will overwrite your markup code and remove the cache = false bit. You can check this by doing "View Storage Format" on your page and looking to see that all your issue macros have <ac:parameter ac:name="cache">false</ac:parameter>.
Next thing you could try is to actually put the full jql after jqlQuery= when entering the markup, rather than referring to a filter, to see if that makes a difference
Beyond that, there's really not much more I can do to help you, because I'm just a user like you. Maybe it could be:
- a bug/problem with Confluence (in which case you could raise a bug with Atlassian on their public issue tracker at: https://jira.atlassian.com/projects/CONF or contact them directly via the support portal: https://support.atlassian.com/customer/servicedesk-portal)
or
- a bug/problem with the "dateCompare" is function provided by ScriptRunner for JIRA that is causing inconsistent results when multiple JIRA issue filters are called from a Confluence page. Maybe try requesting help via Adaptavist's support portal which is here: https://productsupport.adaptavist.com/servicedesk/customer/portal/2/user/login?destination=portals
Sam
You must be a registered user to add a comment. If you've already registered, sign in. Otherwise, register and sign in.

Using the jqlQuery= instead of url= fixed the problem for me under Confluence 6.0.4. Does anyone know if this is fixed in newer versions of Confluence? Also, I don't see jqlQuery even listed as a parameter under even the latest Documentation for the JIRA Issues Macro. Is it documented somewhere else? https://confluence.atlassian.com/doc/jira-issues-macro-139380.html
You must be a registered user to add a comment. If you've already registered, sign in. Otherwise, register and sign in.


You must be a registered user to add a comment. If you've already registered, sign in. Otherwise, register and sign in.