Community resources
Community resources
- Community
- Q&A
- Jira Service Management
- Questions
- System Reporting Under 'Projects/Reports/SLA goals
System Reporting Under 'Projects/Reports/SLA goals
Hi,
How are the SLA goals system reporting calculated?
When creating similar reports on EasyBI I am getting different values. My SLA seems to be higher than the system calculated on ''Projects/Reports/SLA goals'
Any ideas?
Thanks.
Regards,
Joyce
2 answers
1 accepted
Hello @Joyce Anderson
Thank you for reaching out.
I see your question is flagged as Jira Service Management Cloud, however, the SLA goals report is only available on Jira Service Management Server. Can you please confirm if you are using Jira Server or if you are using a third-party plugin on Cloud to provide that report?
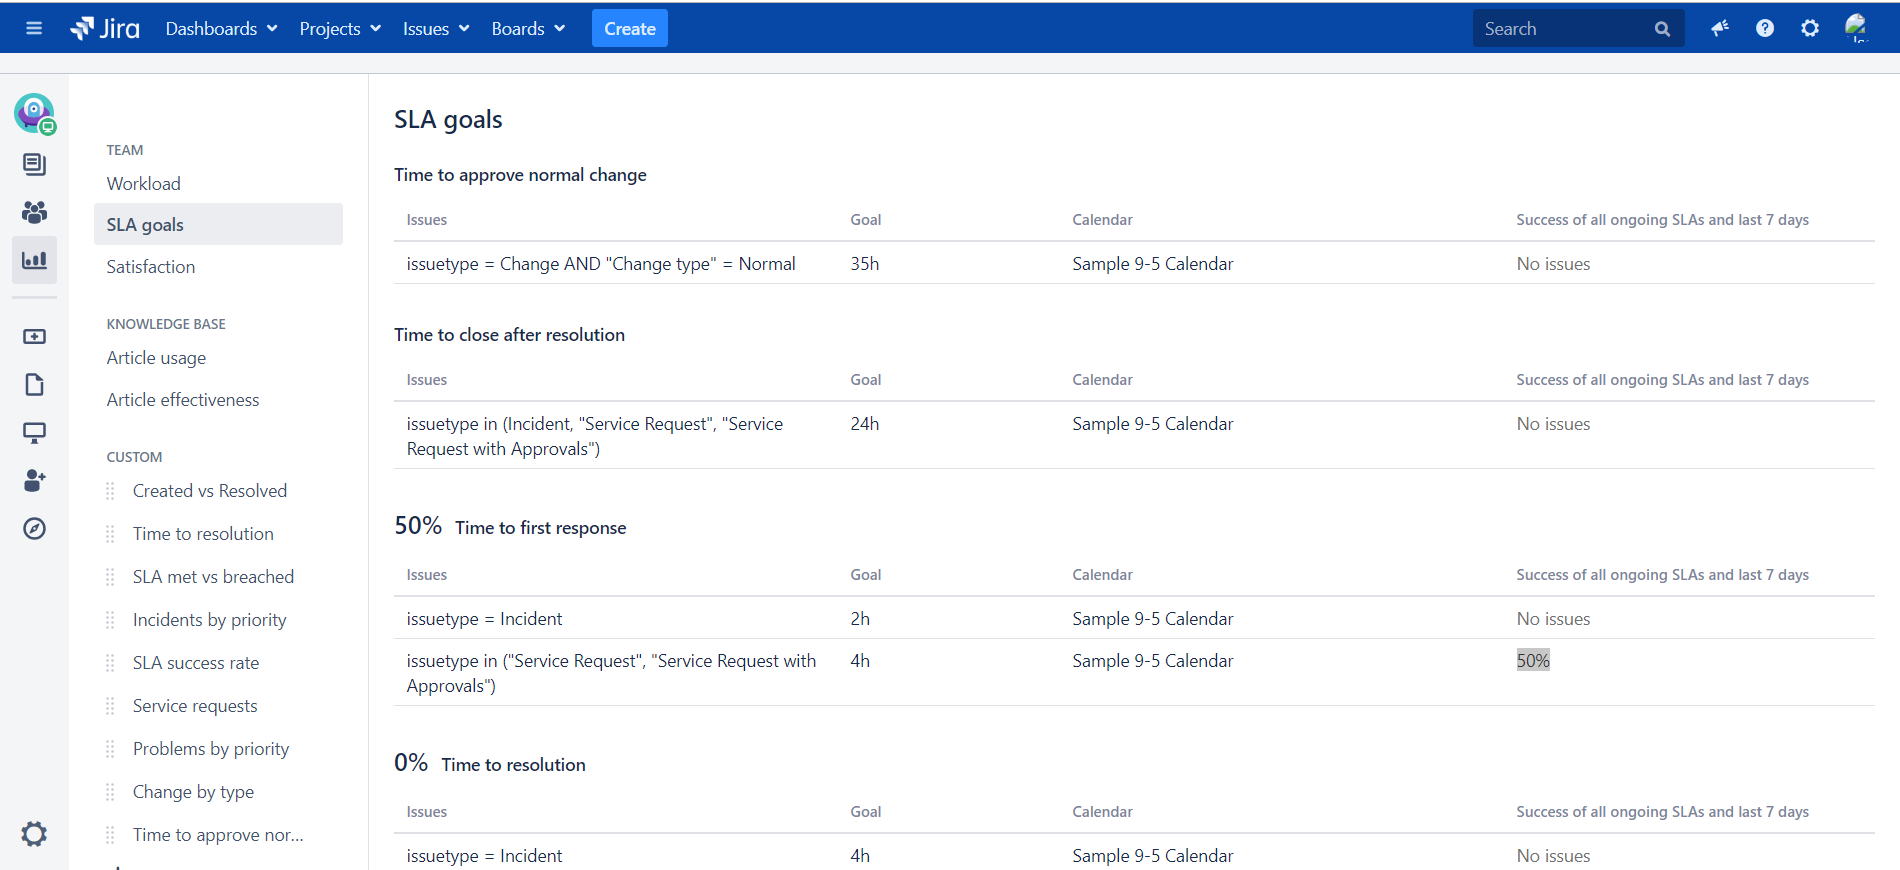
If you are using Jira server, this documentation clearly explains how the report "SLA goals" is calculated with a few examples:
That's how the SLA goals are calculated according to the documentation Reporting for SLAs:
#GOAL_SUCCESS_PERCENTAGE (for the last 7 days) = SUCCESSFUL / TOTAL

#SUCCESSFUL (for the last 7 days) = issues having an SLA that is completed (SLA not running any more) AND successful (SLA is not breached) in the last 7 days

#TOTAL (for the last 7 days) = issues having an SLA that is breached (regardless of the SLA being still running or not) OR completed (SLA is not running any more) in the last 7 days
--------------------------------------------
#OVERALL_SUCCESS_PERCENTAGE = (SUCCESSFUL_GOAL_1 + SUCCESSFUL_GOAL_2 + ...) / (TOTAL_GOAL_1 + TOTAL_GOAL_2 + ...)
Example:
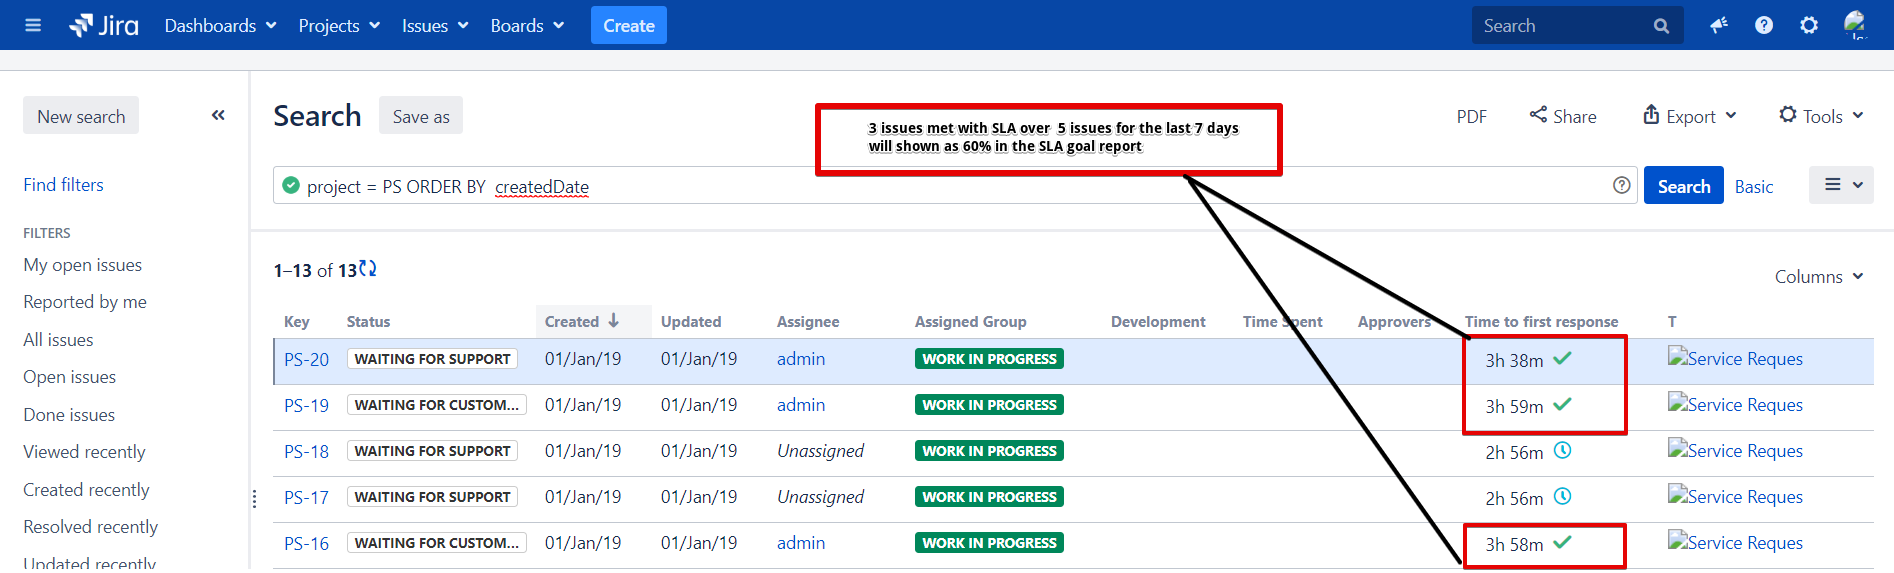
Below is an example of 3 issues where the Time to first response SLA is completed and not breached over a total of 5 issues (3 issues where SLA is running and another 2 issues that are still ongoing)
The calculation would be as below:
#GOAL_SUCCESS_PERCENTAGE (for the last 7 days) = 3 / 5 which is 60%

#SUCCESSFUL (for the last 7 days) = 3 (SLA completed and not breached)

#TOTAL (for the last 7 days) = 2 (Ongoing SLA that is not breached) + 3 (SLA completed) + 0 (Ongoing SLA that is breached) = 5
--------------------------------------------
#OVERALL_SUCCESS_PERCENTAGE = (3 + 0) / (5 + 0) = 3 / 5 which also return 60%, Overall percentage is added by 0 since there is no issue existed on the first goal.
P.S: Please take note of the SLA goals the total will include all of the issues where the SLA is still running/ongoing whether it is breached or not.

Let us know if this information helps.
Hi Peter,
Thanks for the reply. The explanation make sense, as the SLA goals total, include issues which still have SLA running. So the deference with my calculation will be as I am filtering on issues with completed SLA.
My filter are more focus on Status of the issue, If the issue is still open, I measure on 'Active Issues SLA', and if the issues are resolved I measure on 'Resolved Issues SLA'.
Does the filter 'for the last 7 days' filter Issues with 'SLA started the last 7 days'?
Kind Regards Joyce
You must be a registered user to add a comment. If you've already registered, sign in. Otherwise, register and sign in.
Another question;
Again on the 'workload' report looking at issues in Progress, seems to have higher number, than if I create the reports form eazyBI.
Somehow on EazyBI i don't get tickets with issue type 'ITSD Joiner/ Leaver/Mover IT Checklist'. I have filter for all Active status. Are these issues included on 'Time to resolution- Met/Breached' measures?
Thanks.
Joyce
You must be a registered user to add a comment. If you've already registered, sign in. Otherwise, register and sign in.

You must be a registered user to add a comment. If you've already registered, sign in. Otherwise, register and sign in.