Community resources
Community resources
Community resources
Jira Sprint Reporting
I am looking for ideas/recommendations on how a Sprint reporting can be done to show the velocity/overview of the sprint to the management.
I have created a Sprint reporting Dashboard in Jira and once a sprint is completed, Jira also generates a Sprint Report but apart from these what other ways/tools can be used to depict how many story points were added to the sprint and how much was the team able to accomplish? What was our Velocity in the sprint?
4 answers
Hello ruchiuppal@Orthofix.com ,
I would like to introduce you to a very advanced tool with which you can easily access the reports you request. I can recommend Timepiece - Time in Status for Jira which is built by my team at OBSS. It is available for both Jira Cloud, and Data Center.
Time in Status mainly allows you to see how much time each issue spent on each status or each assignee.

You can combine the time for multiple statuses to get metrics like Issue Age, Cycle Time, Lead Time, Resolution Time etc.
You can easily use your predefined sprints as filter type and you can create reports calculated specially for your sprints.

For all numeric report types, you can calculate averages and sums of those durations grouped by the issue fields you select. For example total in-progress time per customer or average resolution time per sprint, week, month, issuetype, request type, etc. The ability to group by parts of dates (year, month, week, day, hour) or sprints is particularly useful here since it allows you to compare different time periods or see the trend.

The app calculates its reports using already existing Jira issue histories so when you install the app, you don't need to add anything to your issue workflows and you can get reports on your past issues as well. It supports both Company Managed and Team Managed projects for Jira Cloud.
Time in Status reports can be accessed through its own reporting page, dashboard gadgets, and issue view screen tabs. All these options can provide both calculated data tables and charts.


Timepiece - Time in Status for Jira
Hope it helps,
Gizem
1. You can try Reports - Charts and Graphs for Jira Dashboard app developed by our team to create various reports, charts and graphs for your Jira projects.
Below you can see an article about creating custom reports, charts and graphs in Jira with our app.
How to Create Custom and Flexible Reports, Charts and Graphs in Jira
Here is our live demo dashboard where you can see and modify sample reports and play with them.
For more detail, you can have a look at Reports - Charts and Graphs for Jira How to Videos.
2. You can try Status Time Reports app developed by our team. It mainly provides reports and gadgets based on how much time passed in each status.
If you are interested in cycle time & lead time, you can have a look at the article below.
Cycle Time and Lead Time in Jira: Productivity Measurement with Two Critical Parameters
Here is the online demo link, you can see it in action and try without installing the app.
For further details, you can have a look at Status Time Reports How to Videos.
Hope it helps.
You must be a registered user to add a comment. If you've already registered, sign in. Otherwise, register and sign in.
If you are migrating to the Jira Cloud I wanna suggest you to try a new Sprint Performance Report feature in Time in Status for Jira Cloud where we have all the metrics for each sprint. You can see here added, removed, completed and not completed Story points and your team Velocity in the sprint.
.png")
I would be happy if you had a look at it!
Try Time In Status for Jira + Sprint Report for free.
You can also book a live demo - we'll show you the application inside out and answer all your questions.
Have a nice day, and happy sprinting 🥳
You must be a registered user to add a comment. If you've already registered, sign in. Otherwise, register and sign in.
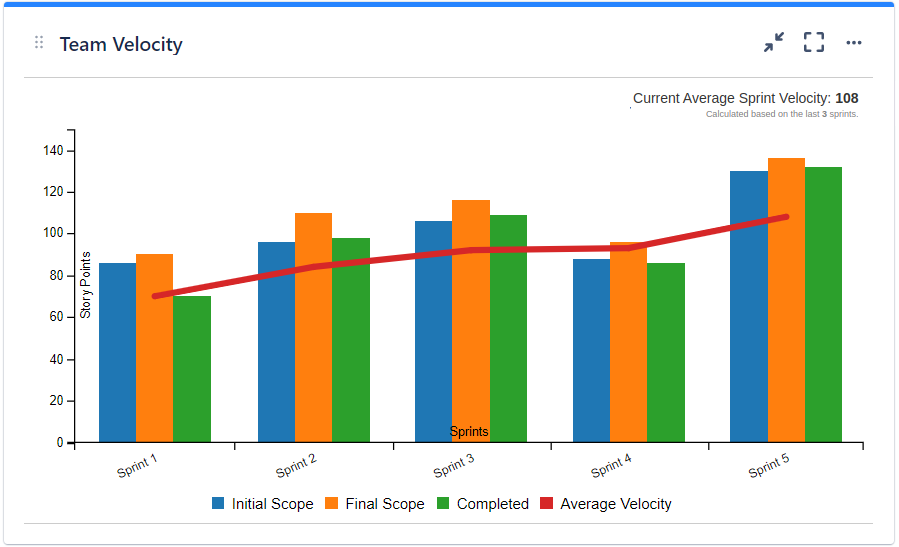
Your best option here would be to create a Jira dashboard with all the gadgets in place for tracking your Scrum team effectively.
Our Great Gadgets app offers all you need to build such dashboard: velocity charts, sprint burndown/burnup, release burndown, and many others.
The Team Velocity gadget gives you all the info that you mentioned in your question and much more (scope change, added, remove, etc):
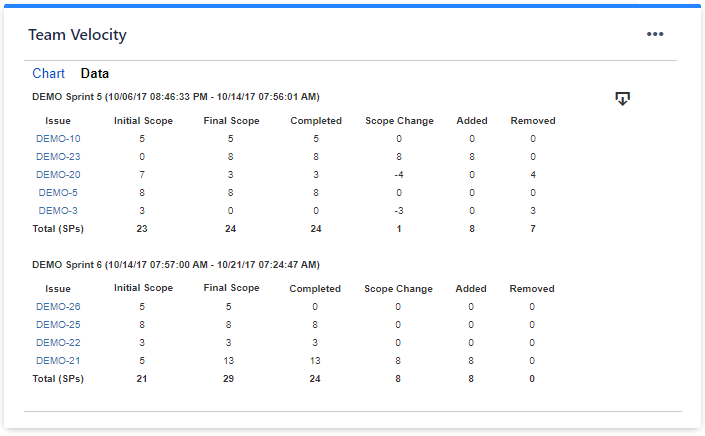
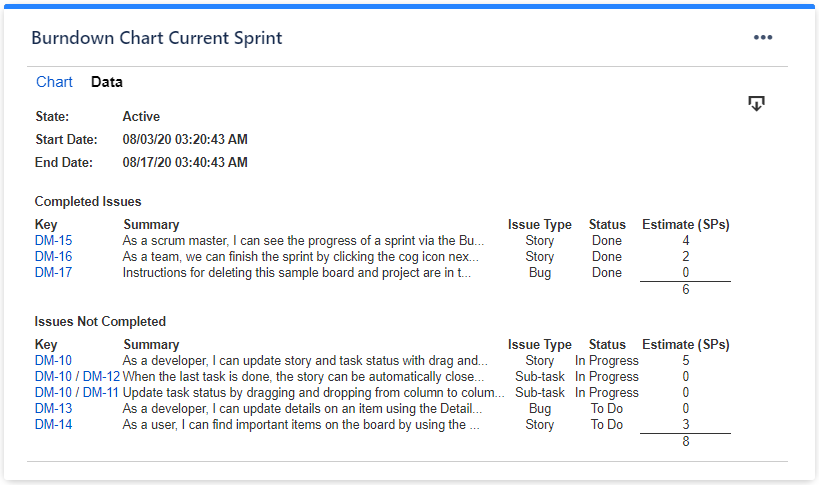
These gadgets can display a data tab with a nice report that you can easily export in CSV:
Have a look over these articles on our blog so find for more details and how to use it:
- 8 gadgets for a powerful Scrum dashboard in Jira
- How to track multi-team or scaled-agile projects (such as SAFe®) in Jira with Great Gadgets app
I hope this helps.
Danut.
You must be a registered user to add a comment. If you've already registered, sign in. Otherwise, register and sign in.

You must be a registered user to add a comment. If you've already registered, sign in. Otherwise, register and sign in.