Have more fun with Kudos
- Collect badges and make progress
- Participate in fun challenges
- Climb up the leaderboard
- Gift Kudos to your peers
Community resources
Community resources
Community resources


- Community
- Products
- Confluence
- Questions
- Create a Chart that Shows Running Totals of Open Tickets
Create a Chart that Shows Running Totals of Open Tickets
Hello,
I have been attempting to create a chart that shows the number of tickets opened, closed, and cumulative open tickets, by week.
I have gotten the open and closed chart created and ideally would like the cumulative open shown on the same chart
However if this isn't possible, I just need to know how I could create a chart that shows tickets open minus tickets closed per week showing a running or cumulative total.
I have been trying to do this using a combination of the Jira macro, pivot table, table filters, and table transformers.
Thanks for any help
2 answers

Hi @Sophia Kroening ,
It should be possible with the Table Filter and Charts for Confluence app that you've mentioned.
Both the Pivot Table and the Table Transformer macro allow cumulative counting.
Please refer to our support. Attach a screenshot of your Jira Issues macro (in a published state without any macros and with visible headers) and the page storage of your page (upper right corner -> menu ... -> View storage format). We'll be able to recreate your source table and your macros with all the settings and guide you through the case.
Hi @Sophia Kroening,
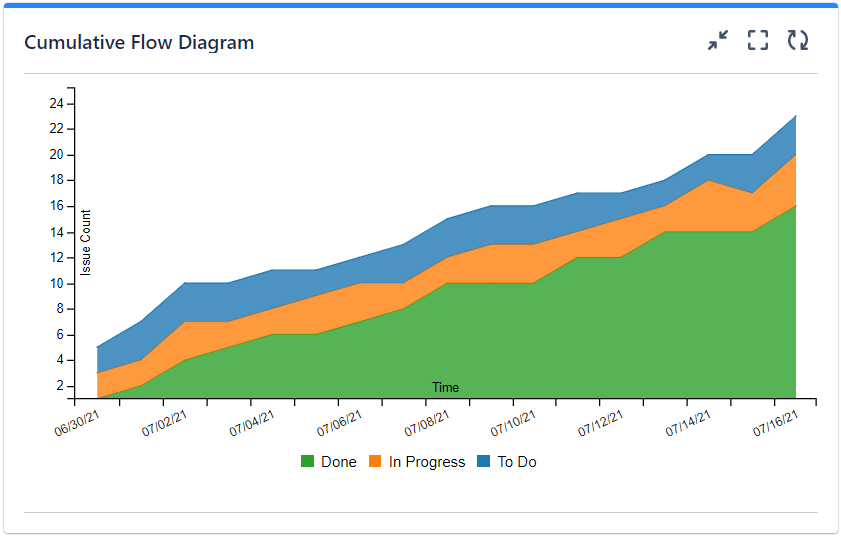
This can be easily done by using the Cumulative Flow Diagram Chart (CFD) gadget offered by our Great Gadgets app available for both Jira and Confluence.
This gadget is highly configurable and allows grouping data by various categories (like status, or status category) and can display weeks on its timeline. You can configure it not to display the "Done" band, thus displaying only the open (To Do and In Progress) tickets, exactly as you want.
This is how it looks like:
This app offers many other gadgets that will make you job easier and more efficient. Have a look over the articles from our blog to see how many things you can track with this app.
I hope this helps. If you have any questions, don't hesitate to contact us at support@stonikbyte.com.
Danut.
You must be a registered user to add a comment. If you've already registered, sign in. Otherwise, register and sign in.


You must be a registered user to add a comment. If you've already registered, sign in. Otherwise, register and sign in.