Community resources
Community resources
Community resources
- Community
- Products
- Jira Service Management
- Questions
- Time to resolution
Time to resolution

Can someone pls explain to me how that works
5 answers
Hi @ahmad_muhammad 👋
Welcome to the Atlassian Community!
Time to resolution means the time it takes to resolve an issue from the moment it is created until it is successfully resolved.
Some of add-ons might be useful for time to resolution:
Time in Status for Jira automatically shows the time each issue spends in each status.
Time Between Statuses generates reports of the transition time from one status to another.


These apps were developed by my team, so let me know if you need further help.
Add-ons have a 30-day free trial version and free up to 10 users.
Hope it helps 😌

Time to resolution being the time between the ticket first being opened to when it was last marked as resolved.
You must be a registered user to add a comment. If you've already registered, sign in. Otherwise, register and sign in.
Welcome to the Atlassian Community!
If you prefer to use a marketplace app, you can try Status Time Reports app developed by our team. It mainly provides reports and gadgets based on how much time passed in each status.
You can get issue resolution time by using cycle time(the time it takes for the team to start working on an issue and complete it) or lead time(the time interval between the moment an issue is requested to the moment it is completed) report. Here is the online demo link, you can see it in action and try without installing the app. For your case, you can have a look at Lead Time for Each Issue and Cycle Time for Each Issue reports.
For further details, you can have a look at Cycle Time and Lead Time in Jira: Productivity Measurement with Two Critical Parameters article and Status Time Reports How to Videos.
- This app has a dynamic status grouping feature so that you can generate various valuable reports as time in status, time in assignee, status entry dates and status counts, cycle time and lead time, average/sum reports by any field(e.g. average in progress time by project, average cycle time by issue creation month).
- You can search issues by Project, Issue Type, Status, Assignee, Issue Creation/Resolution Date(and any other Date field) and JQL Query.
- Status durations are calculated according to the working calendar you define. Once you enter your working calendar into the app, it takes your working schedule into account too. That is, "In Progress" time of an issue opened on Friday at 5 PM and closed on Monday at 9 AM, will be a few hours rather than 3 days.
- You can set different duration formats.
- You can export reports in CSV file format and open them in MS Excel.
- You can also add this app as a gadget to your Jira dashboards and reach “Status Time” from Issue Detail page.
- You can enable/disable access to Status Time reports&gadgets and Issue Detail page per project, users, groups or project role.
If you are looking for a completely free solution, you can try the limited version Status Time Reports Free.
Hope it helps.
You must be a registered user to add a comment. If you've already registered, sign in. Otherwise, register and sign in.
Hello @ahmad_muhammad ,
Welcome to the community!
Time to Resolution or in other words Resolution Time focuses on the duration it takes to resolve issues or incidents, often measured from the moment a problem is reported, to its eventual resolution.
If you wish to calculate the resolution time of your Jira Issues, I can recommend Timepiece - Time in Status for Jira app which is built by my team at OBSS. It is available for both Jira Cloud, and Data Center.
Time in Status mainly allows you to see how much time each issue spent on each status or each assignee. You can combine the time for multiple statuses to get metrics like Issue Age, Cycle Time, Lead Time, Resolution Time etc. (Please see the screenshot below)

For all numeric report types, you can also calculate averages and sums of those durations grouped by the issue fields you select. For example total in-progress time per customer or average resolution time per sprint, week, month, issuetype, request type, etc. The ability to group by parts of dates (year, month, week, day, hour) or sprints is particularly useful here since it allows you to compare different time periods or see the trend.

The app calculates its reports using already existing Jira issue histories so when you install the app, you don't need to add anything to your issue workflows and you can get reports on your past issues as well. It supports both Company Managed and Team Managed projects for Jira Cloud.
Time in Status reports can be accessed through its own reporting page, dashboard gadgets, and issue view screen tabs. All these options can provide both calculated data tables and charts.
Visit Timepiece - Time in Status for Jira to explore how our JIRA add-on can revolutionize your metrics measurement process. Enjoy a 30-day free trial to experience the full range of features.
If you wish, you can also schedule a live demo. We will provide a comprehensive overview of the application and address any inquiries you may have.
Hope it helps,
Gizem
You must be a registered user to add a comment. If you've already registered, sign in. Otherwise, register and sign in.
Hi @ahmad_muhammad,
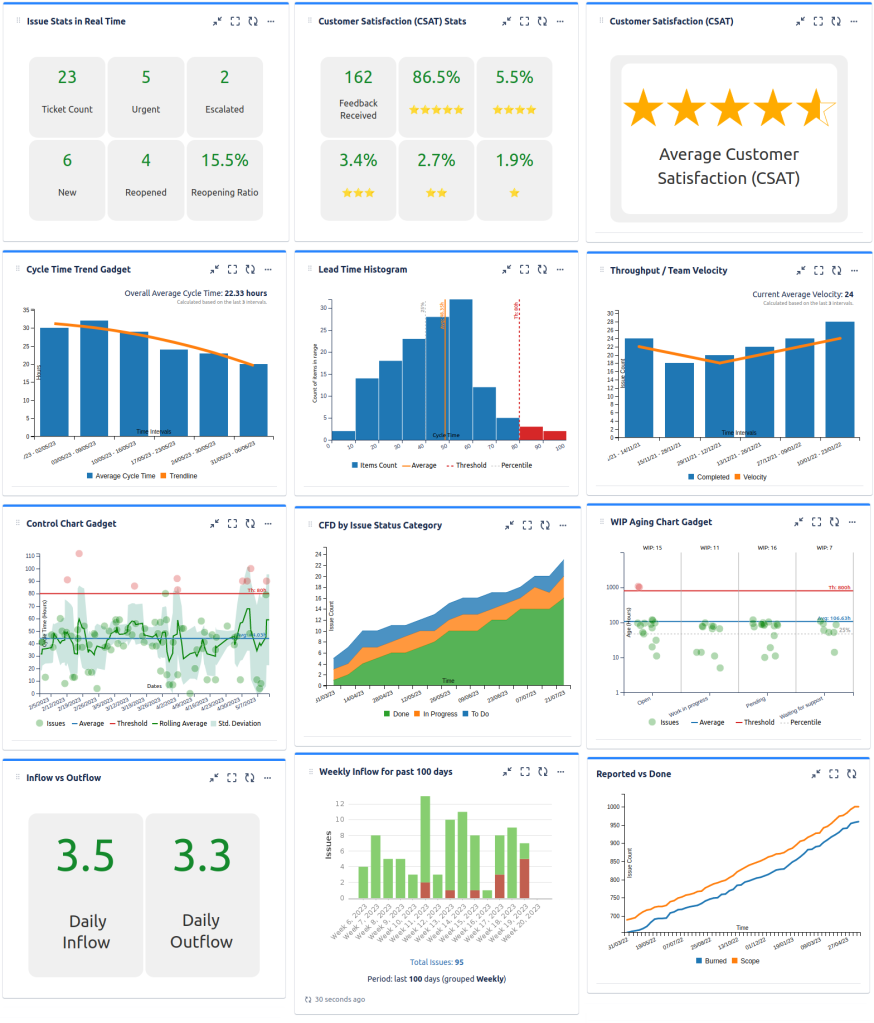
If you want to track time to resolution, a better alternative to Jira's reports is our Great Gadgets app.
It offers many gadgets for tracking Time To Resolution and, very important, you decide when configuring the gadgets how to measure it. Here are some examples of measuring time to resolution, cycle time or lead time.
Trend Chart - calculates and displays the time to resolution /cycle time / lead time for past time intervals along with the trend line to see if your team improves over time.

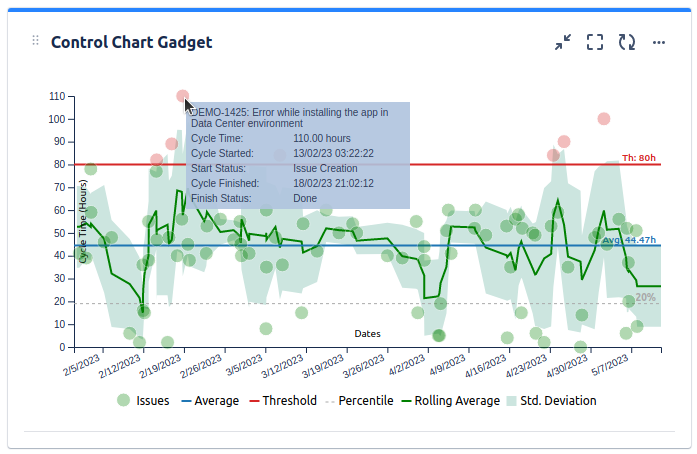
Control Chart - this displays the issues by their time to resolution / cycle time / lead time. You have the option to set a threshold, so that the chart can highlight the issues that took longer.
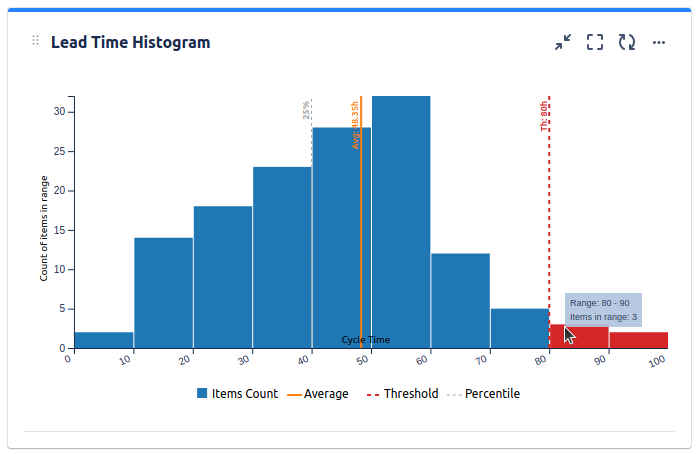
Histogram Chart - displays the issues by their time to resolution / cycle time / lead time, showing how many breached the SLA
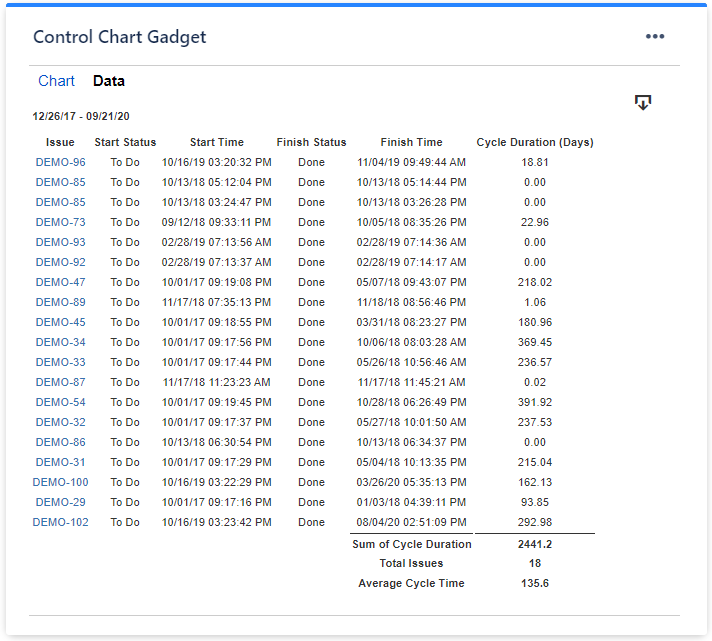
These gadgets are based on Jira filters. All of them can also display a Data tab, showing the chart data, which you can easily export in CSV.
This app offers many other gadgets that you will find useful. Just have a look over our blog to make an idea.
It definitely can be a great asset for your team and your company.
Thank you,
Danut Manda
You must be a registered user to add a comment. If you've already registered, sign in. Otherwise, register and sign in.


You must be a registered user to add a comment. If you've already registered, sign in. Otherwise, register and sign in.