Just a heads up: On March 24, 2025, starting at 4:30pm CDT / 19:30 UTC, the site will be undergoing scheduled maintenance for a few hours. During this time, the site might be unavailable for a short while. Thanks for your patience.
×Have more fun with Kudos
- Collect badges and make progress
- Participate in fun challenges
- Climb up the leaderboard
- Gift Kudos to your peers
Community resources
Community resources
Community resources


- Community
- Products
- Jira Service Management
- Questions
- ticket response statistics
ticket response statistics
Hello,
I have a few customers who would like to know the response time of their technician when we respond to their support request via Jira.
I wanted to know if there's a way, either through JQL, dashboard, widget, application or other, to get this information.
I saw in a JQL query that there are the fields "comment", "author" and we specify the users but in my case would be all the users in the organization and not just one or two.
Also, I saw that I could use the approach of how long the ticket has been in a status such as "waiting for customer" but I haven't found anything optimal yet.
This way, I'll be able to provide more statistics to our customers about their response time to our tickets, how long on average per week/month and what they can do to improve.
Do you have any ideas?
Thanks
5 answers
Alternatively, you can use third-party apps with more functionality for such requests. For example, for tracking SLAs and related reports, I suggest you try the SLA Time and Report for Jira add-on, where you can create SLA configurations and set up report filters on an intuitive interface.
According to your request, here you can choose not only SLAs with Time to First Response but also choose which SLA goals to show in the report and which ones to exclude.

For the report with "Waiting for the client" (or other) status, you will need to create an appropriate SLA and then select it for the report. If you need more reports, consider the Time in Status add-on, with much greater report functionality.

Our company developed these applications, so if you want to know more about their benefits, use the 30-day trial periods to try both of them or book a demo call with our manager.

You could use the JQL below and add in the columns time to first response and time to resolution.
"Time to first response" = breached()
"Time to first response" != breached()
"Time to Resolution" != breached()
"Time to Resolution" = breached()
You can also save this as a filter and apply it to a dashboard.

See the Dashboard:

I hope it helps!
Regards,
Anthony
You must be a registered user to add a comment. If you've already registered, sign in. Otherwise, register and sign in.
You must be a registered user to add a comment. If you've already registered, sign in. Otherwise, register and sign in.
Hi @Emmanuel F-D,
You could try our Great Gadgets app. One of the many gadgets that it offers is the Control Chart gadget that allows you to see the issues by their cycle time. Examples: from creation to "Done", or from creation to "Waiting customer", or between any workflow statuses at your choice.
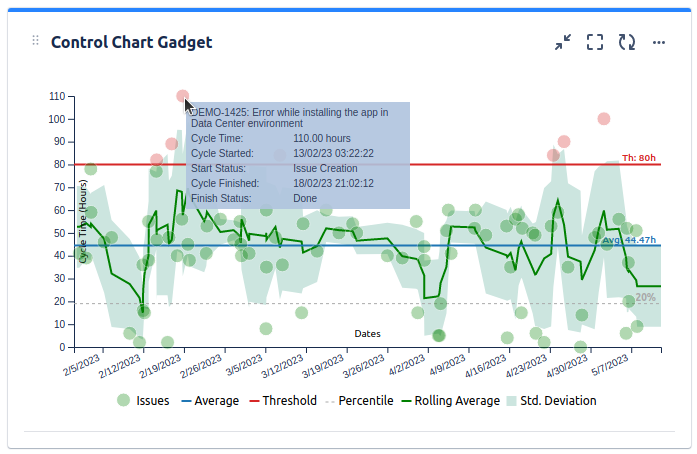
All you have to do is to create a filter for each customer, that returns the issues of that customer. Then, configure a gadget for each customer with the apprpriate filter and you will have the chart!
Hovering the mouse over an issue, will give you details about it. Also, the chart displays the average and gives you the option to set a threshold, to easily identify those issues that took longer (than your SLA agreed with that customer).
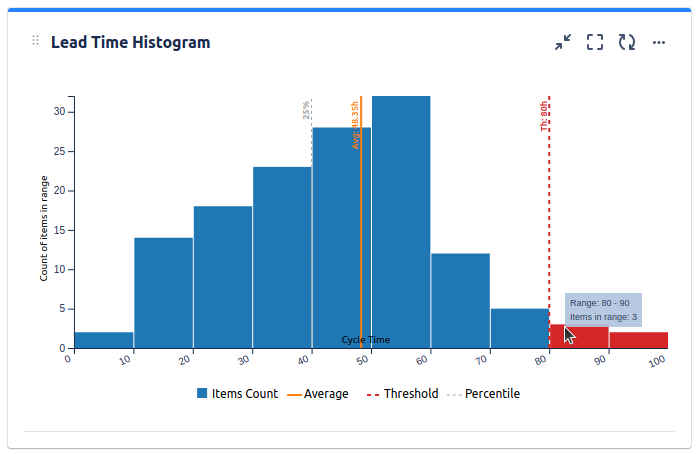
You can also use the Histogram chart offered by the same app, which tells you how many issues were in different response ranges and the average.
The app offers many other gadgets that you might find useful. To make a better idea, have a look on the articles from our, for example this one: An effective dashboard for Service Desk and Customer Support teams in Jira Service Management .
If you need any help, please don't hesitate to contact support@stonikbyte.com.
Thank you,
Danut M.
You must be a registered user to add a comment. If you've already registered, sign in. Otherwise, register and sign in.
As an alternative, you can try Status Time Reports app developed by our team. It mainly provides reports and gadgets based on how much time passed in each status.
Here is the online demo link, you can see it in action and try without installing the app. For your case, you can have a look at Time in Status for Each Issue report. For further details, you can have a look at Status Time Reports How to Videos.
- This app has a dynamic status grouping feature so that you can generate various valuable reports as time in status, time in assignee, status entry dates and status counts, cycle time and lead time, average/sum reports by any field(e.g. average in progress time by project, average cycle time by issue creation month).
- You can search issues by Project, Issue Type, Status, Assignee, Issue Creation/Resolution Date(and any other Date field) and JQL Query.
- Status durations are calculated according to the working calendar you define. Once you enter your working calendar into the app, it takes your working schedule into account too. That is, "In Progress" time of an issue opened on Friday at 5 PM and closed on Monday at 9 AM, will be a few hours rather than 3 days.
- You can set different duration formats.
- You can export reports in CSV file format and open them in MS Excel.
- You can also add this app as a gadget to your Jira dashboards and reach “Status Time” from Issue Detail page.
- You can enable/disable access to Status Time reports&gadgets and Issue Detail page per project, users, groups or project role.
If you are looking for a completely free solution, you can try the limited version Status Time Free.
Hope it helps.
You must be a registered user to add a comment. If you've already registered, sign in. Otherwise, register and sign in.
Hello @Emmanuel F-D ,
The data needed for such a measurement is present in each issue's history but Jira does not give this as a ready-to-use report. For that, you will need to use a marketplace app.
Our team at OBSS built Timepiece - Time in Status for Jira exactly for this. It is available for Jira Server, Cloud, and Data Center.
Time in Status mainly allows you to see how much time each issue spent on each status or each assignee.


You can combine the time for multiple statuses to get metrics like Issue Age, Cycle Time, Lead Time, Resolution Time etc.
For all numeric report types, you can calculate averages and sums of those durations grouped by the issue fields you select. For example total in-progress time per customer or average resolution time per sprint, week, month, issuetype, request type, etc. The ability to group by parts of dates (year, month, week, day, hour) or sprints is particularly useful here since it allows you to compare different time periods or see the trend.

The app calculates its reports using already existing Jira issue histories so when you install the app, you don't need to add anything to your issue workflows and you can get reports on your past issues as well. It supports both Company Managed and Team Managed projects for Jira Cloud.
Time in Status reports can be accessed through its own reporting page, dashboard gadgets, and issue view screen tabs. All these options can provide both calculated data tables and charts.


Timepiece - Time in Status for Jira
EmreT
You must be a registered user to add a comment. If you've already registered, sign in. Otherwise, register and sign in.

Was this helpful?
Thanks!
DEPLOYMENT TYPE
CLOUDPRODUCT PLAN
PREMIUMPERMISSIONS LEVEL
Product AdminUpcoming Jira Service Management Events
- FAQ
- Community Guidelines
- About
- Privacy policy
- Notice at Collection
- Terms of use
- © 2025 Atlassian
You must be a registered user to add a comment. If you've already registered, sign in. Otherwise, register and sign in.