Community resources
Community resources
Community resources


Can I create a forecast chart with a custom metric?
Hi everyone,
I want to know if the following workflow is possible in Jira. We're exporting data from a project into excel. There, we calculate the average story points for all the stories we estimated, and the average amount of stories per Epic. We then get the number of epics with no story, and multiply that by the average amount of stories per epics, and then by the average story points per story, adding that to the total story points of epics with stories and story points that we did not worked yet. With this, we have an estimation of the total points for the project.
Finally, we divide this total number of estimated points by our teams velocity, and plot it by date (or sprint start date), to visualize what's our end date estimation.
Can we create this custom metric in Jira, without having to export the information to excel, and then plot it by date so it automatically refresh when a story or epic is updated?
Thanks!
2 answers

Hi @k_cast
Out of the box you may not be able to do this. I would suggest you use eazyBI reporting for Jira that allows you to create custom reports that you mention above. They have great support team and can help you set the report that you need.
Regards,
Fabian
Hi @k_cast,
Yes, you can do this by using the Advanced issue Filter Formula Gadget offered by our Great Gadgets app.
If you have any question, please don't hesitate to contact us at support@stonikbyte.com.
Danut.
You must be a registered user to add a comment. If you've already registered, sign in. Otherwise, register and sign in.
Hi @k_cast,
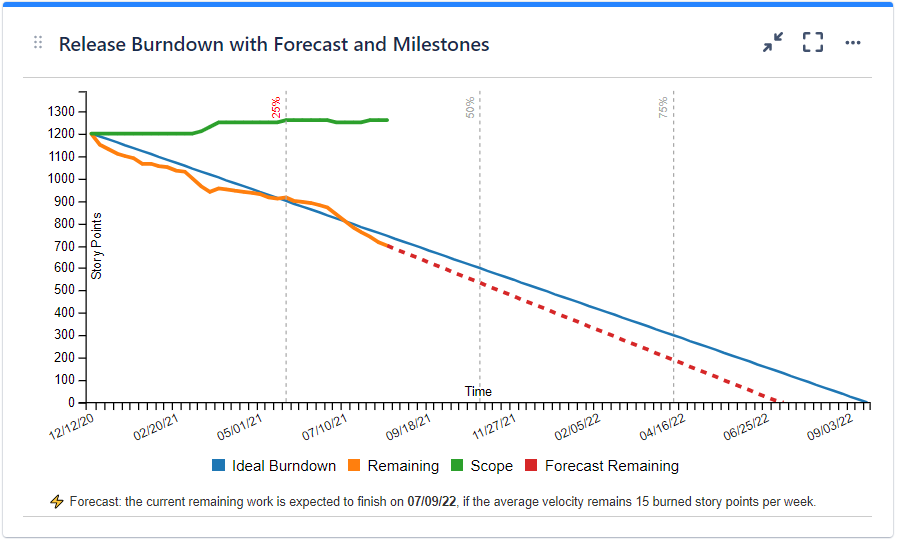
Not sure why you need to do such advanced calculations, but if you manage to have a filter in Jira that includes all the items from your project along with their estimates, you could use our Release Burnup Burndown Chart to display the ETA and the forecast line as in this example. You have also options to adjust the velocity calculation.
Unfortunately, the Advanced Issue Filter Formula Gadget that I mentioned previously can just calculate the number of days (or weeks) based on your advanced formula and display it like this. It cannot plot this as a chart.

We could eventually assist you with any of these options. Just contact support@stonikbyte.com, if it is the case.
Danut.
You must be a registered user to add a comment. If you've already registered, sign in. Otherwise, register and sign in.


You must be a registered user to add a comment. If you've already registered, sign in. Otherwise, register and sign in.