Community resources
Community resources
Custom Charts by Old Street Solutions
Hi,
We are currently using the plugin called "Custom Charts" by Old Street Solutions in our instance. I am not very familiar with the plugin and I was wondering how I could create a chart that would display number of tickets in the Y-Axis and number of days the ticket was open on the X-Axis. I have attached the screenshot for reference. Kindly advise.

Regards,
Sidney
2 answers
2 accepted
Hello, @Sidney Joshua Ambrose,
Have you found a solution with your app vendor? If you are still on the hunt for a solution, our app might be just what you're looking for.
Performance Objectives app supports a powerful metric distribution feature allowing you to use Time and Number metrics as fields and segment them into custom distribution ranges. Here is an example based on your request, which I believe fits your needs perfectly (issues are also stacked by current status for better insights):

I invite you to use the free trial option to explore this feature, along with many other outstanding capabilities, to see if they align your requirements. Our team is ready to assist you in discovering the app's full potential.
Best regards,
Tanya
Not sure if Custom Charts can do this for you. Perhaps is better to ask their support directly.
But what you are looking for is exactly what our Cycle Time Histogram Chart gadget does. This gadget, along with many others, is offered by our Great Gadgets app.
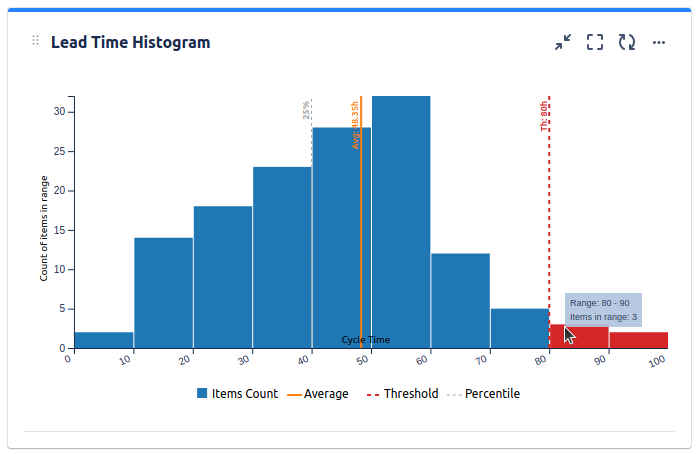 The gadget is highly configurable. You can also set a custom threshold to see how many issues take longer than expected.
Take a look also over our WIP Aging Chart and Control Chart, as they might be very helpful for you. See also An effective dashboard for Service Desk and Customer Support teams in Jira Service Management for examples on how to use these gadgets.
If you have any questions, please don't hesitate to contact us at support@stonikbyte.com.
Thank you,
Danut Manda
You must be a registered user to add a comment. If you've already registered, sign in. Otherwise, register and sign in.

You must be a registered user to add a comment. If you've already registered, sign in. Otherwise, register and sign in.