Have more fun with Kudos
- Collect badges and make progress
- Participate in fun challenges
- Climb up the leaderboard
- Gift Kudos to your peers
Community resources
Community resources
Community resources


Display number of days tickets have been open in a Dashboard Gadget
I would like to add a gadget in my dashboard showing the number of days tickets have been open. How can I do that without using any additional apps? How can I create the filters for it? Please help with the entire procedure
6 answers
If you are still looking for a solution, we were able to implement something "basic" based on a numeric custom field that is being updated by an Automation on a daily basis.
For every day the ticket is "open", the automation is incrementing the value of the custom field.
Hello @[deleted] 👋
As an alternative, you can try Time in Status for Jira Cloud developed by my SaaSJet team. All add-on reports are available in this gadget and you can control time in status data in the Issue List or Chart View.


Share reports with your colleagues or third-party analytical systems or export them to CSV or XLSX files.
This add-on has a 30-day free trial version and free up to 10 users.
Please, let me know if you have any questions 😌
Hope it helps,
Valeriia
You must be a registered user to add a comment. If you've already registered, sign in. Otherwise, register and sign in.
Hi @[deleted]
Welcome to the Atlassian Community!
You can try Status Time Reports app developed by our team. It mainly provides reports and gadgets based on how much time passed in each status.
Here is the online demo link, you can see it in action and try without installing the app.
- This app has a dynamic status grouping feature so that you can generate various valuable reports as time in status, time in assignee, status entry dates and status counts, cycle time and lead time, average/sum reports by any field(e.g. average in progress time by project, average cycle time by issue creation month).
- You can search issues by Project, Issue Type, Status, Assignee, Issue Creation/Resolution Date(and any other Date field) and JQL Query.
- Status durations are calculated according to the working calendar you define. Once you enter your working calendar into the app, it takes your working schedule into account too. That is, "In Progress" time of an issue opened on Friday at 5 PM and closed on Monday at 9 AM, will be a few hours rather than 3 days.
- You can set different duration formats.
- You can export reports in CSV file format and open them in MS Excel.
- You can also add this app as a gadget to your Jira dashboards and reach “Status Time” from Issue Detail page.
- You can enable/disable access to Status Time reports&gadgets and Issue Detail page per project, users, groups or project role.
For further details, you can have a look at Status Time Reports How to Videos.
If you are looking for a completely free solution, you can try the limited version Status Time Free.
Hope it helps.
You must be a registered user to add a comment. If you've already registered, sign in. Otherwise, register and sign in.
Hello @[deleted]
Sorry, but you can't have this without an app. The closest you can get will be Jira's Issue Age Chart but it offers an overall view with very limited flexibility.
Our team at OBSS built Timepiece - Time in Status for Jira exactly for this. It is available for Jira Server, Cloud, and Data Center.
Time in Status mainly allows you to see how much time each issue spent on each status.

You can combine the time for multiple statuses to get metrics like Idea Age, Lead Time, Cycle Time, etc.
For all numeric report types, you can calculate averages and sums of those durations grouped by the issue fields you select. For example total in-progress time per component or average cycle time per product, etc. The ability to group by parts of dates (year, month, week, day, hour) or sprints is particularly useful here since it allows you to compare different time periods or see the trend.

The app calculates its reports using already existing Jira issue histories so when you install the app, you don't need to add anything to your issue workflows and you can get reports on your past issues as well. It supports both Company Managed and Team Managed projects for Jira Cloud.
Time in Status reports can be accessed through its own reporting page, dashboard gadgets, and issue view screen tabs. All these options can provide both calculated data tables and charts.


Timepiece - Time in Status for Jira
EmreT
You must be a registered user to add a comment. If you've already registered, sign in. Otherwise, register and sign in.
Hi @[deleted]
This might not be possible without additional apps.
But if you are going to reconsider the option for using apps, be aware that this can be easily done with our Great Gadgets app. One of the many gadgets that this app offers is the WIP Aging Chart gadget, which shows the issues in a plot chart by their age.
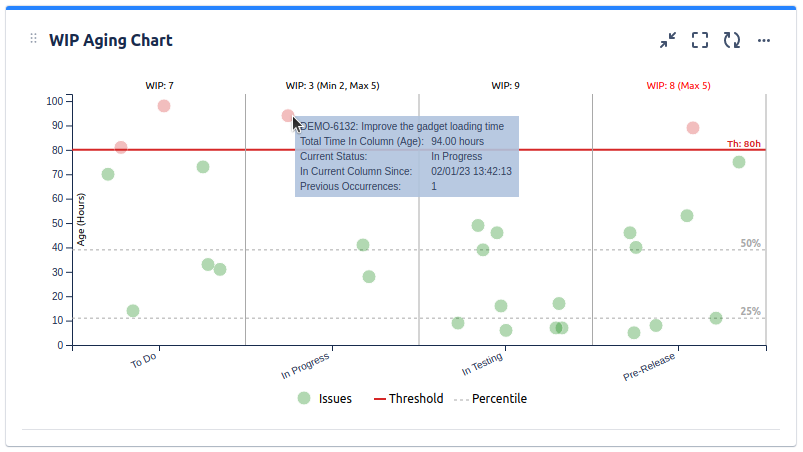
The app give you the option to set a threshold to easily identify the issues that were not yet addressed. Hovering the mouse over a point in the chart will show details about the issue.
This app offers many other gadgets that you might find useful.
If you have questions, please don't hesitate to contact us at support@stonikbyte.com.
Thank you,
Danut Manda
You must be a registered user to add a comment. If you've already registered, sign in. Otherwise, register and sign in.

Hello @[deleted]
Welcome to the Atlassian community.
How are you hoping to have the information presented?
- Do you want a list of issue showing the number of days that have passed since each was created?
- Are you wanting some sort of graphic representation?
- Do you want a tabular presentation that shows how many issues have been open for 1 day, for 2 days, for 3 days, etc?
Do you want only information only for issues that are currently still open, or do you want it for all issues regardless of their current Status?
Do you want the information for issues in particular projects or all projects in the Jira instance?
You must be a registered user to add a comment. If you've already registered, sign in. Otherwise, register and sign in.

Yeah I am looking for presentations that show how many issues have been open for 1 day, for 2 days, for 3 days etc
You must be a registered user to add a comment. If you've already registered, sign in. Otherwise, register and sign in.
Welcome to the Atlassian community.
There is not a native gadget for this. See the other answers for suggestions on third party apps that can help you with this.
You must be a registered user to add a comment. If you've already registered, sign in. Otherwise, register and sign in.


You must be a registered user to add a comment. If you've already registered, sign in. Otherwise, register and sign in.