Just a heads up: On March 24, 2025, starting at 4:30pm CDT / 19:30 UTC, the site will be undergoing scheduled maintenance for a few hours. During this time, the site might be unavailable for a short while. Thanks for your patience.
×Community resources
Community resources
Community resources


JavaScript Chart for JIRA Cloud - Ask field utility
3 answers
1 accepted
Thanks for your answer
I wish to have a graph that shows the evolution of the total number of tickets having the status of JIRA and Proposed Reopened daily.
for example
Thursday 4 tickets have been updated with the status Proposed and 1 with the status reopened-> on the graphic appears 5 tickets
Friday 1 ticket has been updated with the Proposed status and 2 with the status reopened -> on the graphic appears 8 tickets
@Céline,
Thanks for explaining so clearly.
It should now be possible to do what you describe.
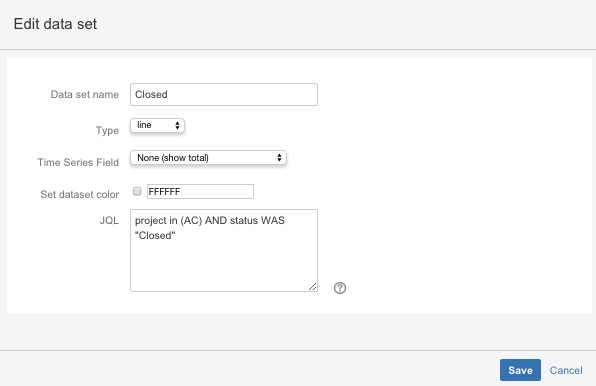
In the "Time Series Field" drop down menu, if you select the "None (show total)" option, then the JQL query will be run repeatedly for each day. (Beware, it can take a while to run, and the graph to generate)
Please note your JQL queries must be phrased in past tense as well...eg:
status WAS "reopened"
Here is the configuration for an example (using Open/Closed instead of Proposed/Reopened):
Screen Shot 2016-03-29 at 10.36.35 am.pngScreen Shot 2016-03-29 at 10.36.17 am.pngScreen Shot 2016-03-29 at 10.35.42 am.png
Screen Shot 2016-03-29 at 10.58.03 am.png
You must be a registered user to add a comment. If you've already registered, sign in. Otherwise, register and sign in.
Thanks for your answer
These conditions doesn't work.
project in (PROJ) AND status in ( "In Progress" ,"Proposed")
project in (PROJ) AND (status was "Proposed" or status was "In Progress" )
Can you tell me why please ?
You must be a registered user to add a comment. If you've already registered, sign in. Otherwise, register and sign in.
Hi @Céline,
I think the correct query for what you are trying to do, should be:
project in (PROJ) AND status WAS in ("Proposed", "In Progress")
You must be a registered user to add a comment. If you've already registered, sign in. Otherwise, register and sign in.
You must be a registered user to add a comment. If you've already registered, sign in. Otherwise, register and sign in.
Hello,
I use my graphic today. By against a JIRA can appear in two status if it changes satut the same day. Is there a component or a way to get the same information that the graphics but with the JIRA issue to see what JIRA is counted twice. Or there has been there a way to take into account in the graph the latest status of JIRA so that it appears a single time.
Thanks for your answers.
You must be a registered user to add a comment. If you've already registered, sign in. Otherwise, register and sign in.
Hi,
The "Time Series Field" is a date that is associated with every bug. For example:
- the date it was created or;
- the date it was resolved or;
- the date it was last updated
This field is what is used as the X value for each data point.
Can you can give a bit more detail about what you want your graph to show?
You must be a registered user to add a comment. If you've already registered, sign in. Otherwise, register and sign in.

Was this helpful?
Thanks!
Community showcase
Atlassian Community Events
- FAQ
- Community Guidelines
- About
- Privacy policy
- Notice at Collection
- Terms of use
- © 2025 Atlassian
You must be a registered user to add a comment. If you've already registered, sign in. Otherwise, register and sign in.